
Solutions
Solve your most critical customer experience challenges

Head of Growth Marketing

The Net Promoter Score is an indicator of customer loyalty that is more and more frequently used by major European companies. Many businesses today are interested in implementing the NPS or have already done so, which is a great move on their part! However, these companies don’t necessarily know how to properly understand their scores.
In this article, you’ll find some tips to help you analyse your own NPS.
This is probably your most burning question, and it’s a good one. The thing is, there’s no right answer. Some sources will tell you that, generally speaking, an NPS above +20 is a good score. Our answer is more nuanced, given that your NPS depends on many factors.
For example, your industry plays a crucial role in your score. It’s much easier for a Customer to recommend Apple or Netflix compared to a company in the banking or insurance industries. This is first and foremost a cultural matter. So, it’s very important to take your industry into account.
The way you collect data also strongly affects your results. Here we distinguish between the Transactional NPS and the Customer Relationship NPS. Data for experience NPS is collected immediately after Customers interact with a company (purchases, contact with Customer service, etc.). Data for Customer Relationship NPS is collected at a specific point in time, not in relation to a recent interaction. The Customer Relationship NPS is more geared toward evaluating a brand’s image. A Transactional NPS is often higher than a Customer Relationship NPS.
You must also take into account the country’s culture. In some places, giving a rating of 9 or 10 is uncommon. This is the case in France, for example, where customers have a reputation for being hard to please. As such, to accurately analyse your NPS, you need to consider it in its overall context.
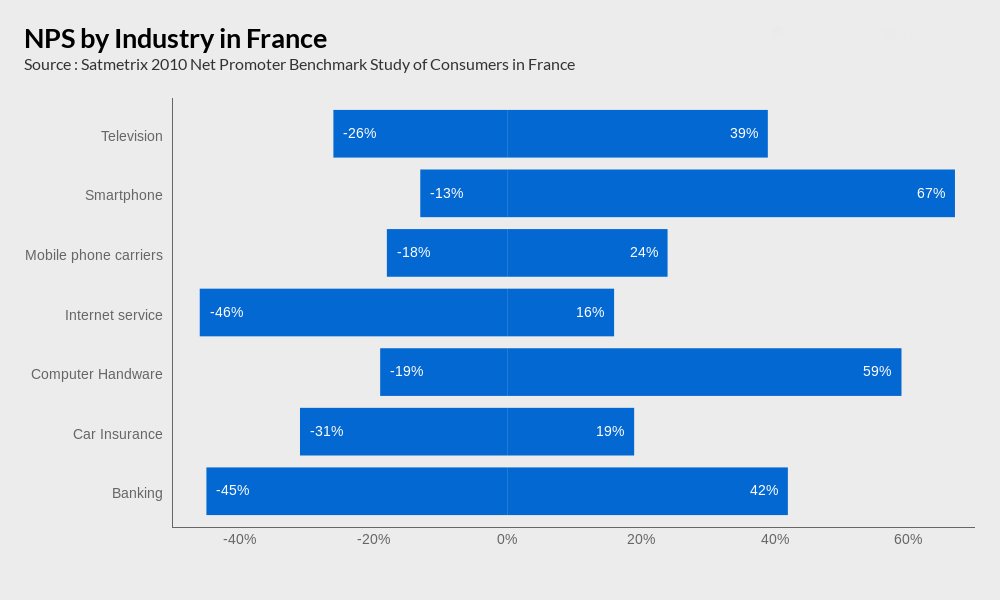
Distribution of NPSes by industry in France in 2010
Yes! It is very useful to be able to compare your NPS to the average for your industry. However, you should bear in mind that scores vary by geographic area and mode of data collection. It only makes sense to compare your score with other companies when the data collection conditions are similar.
This being said, it can be very difficult to find your competitors’ NPS scores. You can easily find NPS scores for big American companies online. These numbers are even used in corporate communication (“8 out of 10 customers recommend our brand”). However, this data remains highly confidential in European countries.

This is where NPS comparison becomes particularly useful. Firstly, if you don’t change your mode of data collection, it is useful to see how your overall NPS changes over time.
Be sure not to compare scores over short periods of time as these periods are likely to include incidental effects (for example, your telephone servers went down or many salespeople fell ill, etc.). It is, however, useful to compare the change in your score from month to month. In particular, this allows you to evaluate the consequences of strategic actions taken. You must also make sure that you get a large enough volume of responses to be able to draw accurate conclusions.
You can also compare NPS scores between retail locations, which can be a very powerful management tool. If the mode of data collection is the same for each of your company’s retail locations, it will be useful to compare their scores.
In so doing, you can identify your highest-performing locations and understand the factors that support a good Customer Experience. At the same time, you can establish action plans (e.g. employee training, changes to the retail space) for retail locations that do not perform as well.
However, analysing just one number, like -10 or +36, is not enough. You have to really dig down into the details, analysing particularly the breakdown of Customers into promoters, passives, and detractors. For example, you may identify two retail locations with the same NPS score, but with completely different distributions of Customers.
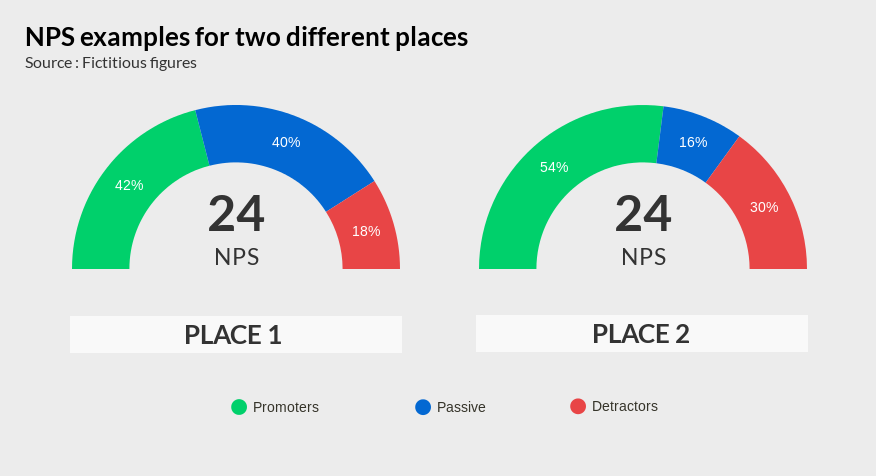
In the above example, both locations received a score of 24. However, Place 2 finds itself in a more critical situation, with a very high percentage of detractors. Remember, a happy customer will share their experience with three people. An unhappy customer will tell ten people. So, taking action on a location like Place 2 should be a priority.
Furthermore, you can take into account the distribution of ratings among detractors. Indeed, a Customer that gives a rating of 6 for the NPS’ ‘ultimate question’ does not have the same mindset as a Customer that gives a 0. And yet, both of these Customers fall into the ‘detractors’ category.
For this reason, some companies divide detractors into multiple categories and apply different action plans accordingly. For example, you could break down the group into moderate detractors (rating of 3 to 6) and super-detractors (rating of 0 to 3). Obviously, priority will be given to addressing the super-detractors, who are very dangerous for a business.
Lastly, at Critizr, we always recommend associating an NPS question with several other questions: closed-ended questions regarding specific aspects of the interaction being evaluated (e.g. Customer service, products) and an open-ended question allowing Customers to express their opinions.
Cross-referencing NPS results with the responses to these associated questions allows you to deepen your analysis and more quickly identify the things that Customers didn’t like. For the open-ended question, it’s useful to do a semantic analysis of the comments received.
It can also be useful to cross-reference the NPS with different key variables. In this era of ‘big data,’ big companies have an enormous amount of information that can help show strategic trends.
It’s a good idea to cross-reference NPS data with RFM (recency, frequency, and monetary value) data. For example, a regular customer of your company who recently gave a bad rating on an NPS survey after having a bad experience would be a Customer you would really want to give special treatment to so that you don’t lose them.
Lastly, you can cross-reference NPS results with marketing segments (Customer type, age, location, etc.). This can help you find trends within the segments that have the most detractors or promoters. For example, if you identify urban youth (18-25 years old living in urban areas) as a major promoter group, you can create street marketing campaigns or sponsor content on social media.
The NPS is an indicator that’s growing in popularity among big companies. Nowadays, it is crucial to collect NPS data. However, this data is not always analysed in a useful or meaningful way. NPS analysis should go beyond just looking at the score so as to turn the NPS into a powerful tool for marketing and management.

Like the article? Spread the word